Population growth Consider the following population functions. e.Use a graphing utility to graph the population and its growth rate. p(t) = 600 (t²+3/t²+9)
Verified step by step guidance
1
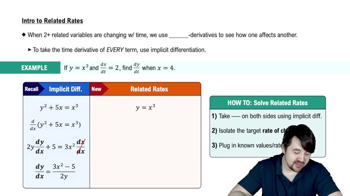
Step 1: Identify the function for the population, which is given as \( p(t) = 600 \left( \frac{t^2 + 3}{t^2 + 9} \right) \). This function represents the population at time \( t \).
Step 2: To find the growth rate of the population, we need to compute the derivative of \( p(t) \) with respect to \( t \). This involves using the quotient rule for derivatives, which is \( \frac{d}{dt} \left( \frac{u}{v} \right) = \frac{u'v - uv'}{v^2} \), where \( u = t^2 + 3 \) and \( v = t^2 + 9 \).
Step 3: Calculate the derivatives \( u' \) and \( v' \). For \( u = t^2 + 3 \), \( u' = 2t \). For \( v = t^2 + 9 \), \( v' = 2t \).
Step 4: Substitute \( u, v, u', \) and \( v' \) into the quotient rule formula to find \( p'(t) \), the growth rate of the population. This gives \( p'(t) = 600 \left( \frac{(2t)(t^2 + 9) - (t^2 + 3)(2t)}{(t^2 + 9)^2} \right) \).
Step 5: Simplify the expression for \( p'(t) \) to obtain a more manageable form for graphing. This involves expanding and combining like terms in the numerator, and then simplifying the entire expression.
Verified video answer for a similar problem:
This video solution was recommended by our tutors as helpful for the problem above
Video duration:
3m
Play a video:
0 Comments
Key Concepts
Here are the essential concepts you must grasp in order to answer the question correctly.
Population Functions
Population functions model the growth of a population over time, often represented as p(t), where t is time. In this case, the function p(t) = 600(t² + 3)/(t² + 9) describes how the population changes based on the variable t. Understanding the structure of this function is crucial for analyzing its behavior and growth patterns.
Graphing utilities are software tools or calculators that allow users to visualize mathematical functions. They can plot graphs of equations, helping to illustrate the relationship between variables. Using a graphing utility to plot the population function and its growth rate provides a visual representation that aids in understanding trends and behaviors in population dynamics.
The growth rate of a population refers to the change in population size over time, often expressed as a derivative of the population function. For the given function, calculating the derivative p'(t) will yield the growth rate, indicating how quickly the population is increasing or decreasing at any point in time. Analyzing the growth rate is essential for understanding the dynamics of population change.

 Verified step by step guidance
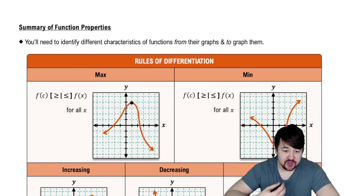
 06:21
06:21