Here are the essential concepts you must grasp in order to answer the question correctly.
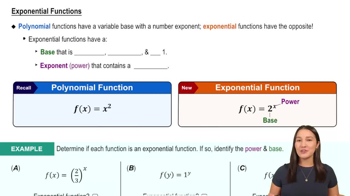
Exponential Functions
Exponential functions are mathematical expressions in the form f(t) = a * e^(kt), where 'e' is the base of natural logarithms, 'a' is a constant, and 'k' is a rate of growth or decay. In the context of tumor volume, the function V(t) = V₀ (0.99e⁻⁰·¹²¹⁶ᵗ + 0.01e⁰·²³⁹ᵗ) describes how the tumor volume changes over time, with different rates of decay represented by the coefficients of the exponential terms.
Recommended video:
Graphing Functions
Graphing functions involves plotting points on a coordinate system to visualize the relationship between variables. For the given function, plotting V(t) over the interval 0 ≤ t ≤ 16 allows us to observe how the tumor size changes over time, identifying trends such as growth or decay. This visual representation is crucial for understanding the dynamics of tumor response to treatment.
Recommended video:
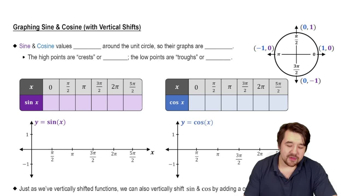
Graph of Sine and Cosine Function
Newton's Method
Newton's Method is an iterative numerical technique used to find approximate solutions to equations, particularly useful for finding roots. In this context, it can be applied to determine when the tumor volume V(t) decreases to half of its original size, V₀/2. By iteratively refining guesses based on the function's slope, this method provides a practical approach to solving complex equations that may not have straightforward analytical solutions.
Recommended video:
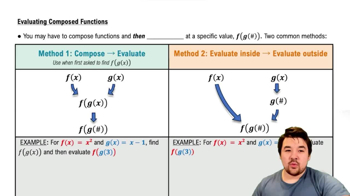
Evaluating Composed Functions