Business Calculus
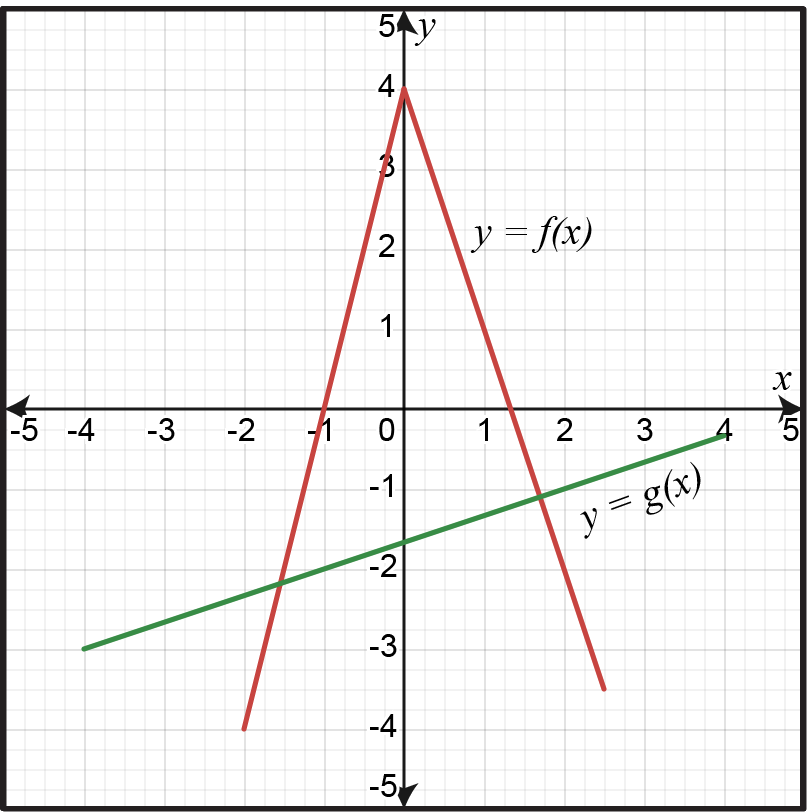
Evaluate the following derivative using the graph given below.
ddx(8f(x)+12g(x))x=2\frac{\text{d}}{\text{dx}}\left(8f\left(x\right)+12g\left(x\right)\right)_{x=2}
(f−1)′(4)\left(f^{-1}\right)^{\prime}\left(4\right)
Identify the function gg and value of aa such that the following limit represents g′(a)g^{\prime}\left(a\right). Then, evaluate the limit by finding the value of g′(a)g^{\prime}\left(a\right).
limx→22x3−16x−2\displaystyle \lim_{x \to 2}{\frac{2x^3-16}{x-2}}
A small town's expansion is modeled by the function S(t)=−140t2+3t+15 S(t) = -\frac{1}{40}t^2 + 3t + 15 , for 0≤t≤600 ≤ t ≤ 600≤t≤60, where SS represents the area in square kilometers and tt is the number of years since 20002000. If the population density remains steady at 800800 people per square kilometer, what is the population growth rate in 20252025?
For the function h(x)=5x−3xh(x)=5\sqrt{x}-3x, identify all the points on the graph of hh where where the graph has a horizontal tangent.
A car accelerates from rest along a straight road and its distance from the starting point is given by the equation S=54t2S=\frac54t^2, where SS is the distance in meters and tt is the time in seconds. If the car needs to reach a speed of 90 km/h90~\text{km/h} to safely merge onto a highway, how long will it take to reach this speed, and what distance will the car cover?